


Braidr’s AI Maturity Evaluation Index: showing our workings


What it took to turn 1.5 million words of evidence about the FTSE 350 into a report we’re willing to defend.
There’s a point in every large AI project where somebody suggests pasting the whole thing into a chatbot and asking for the highlights. We hit that point in June, staring at just over 1.5 million words of AI-maturity evidence covering every company in the FTSE 350. This is why we didn’t, and what we built instead.
The machine that read 1,042 annual reports
The evidence first. AI.M.E. (AI Maturity Evaluation) is our multi-agent research system, built on Google’s Agent Development Kit. It evaluates how mature an organisation’s AI capability really is using only what’s publicly visible: websites, annual reports, press releases, earnings calls, job postings, GitHub activity, even Glassdoor reviews. No surveys went out. Ask a company to rate its own AI maturity mid-hype-cycle and you’re mostly measuring the confidence of whoever filled in the form.
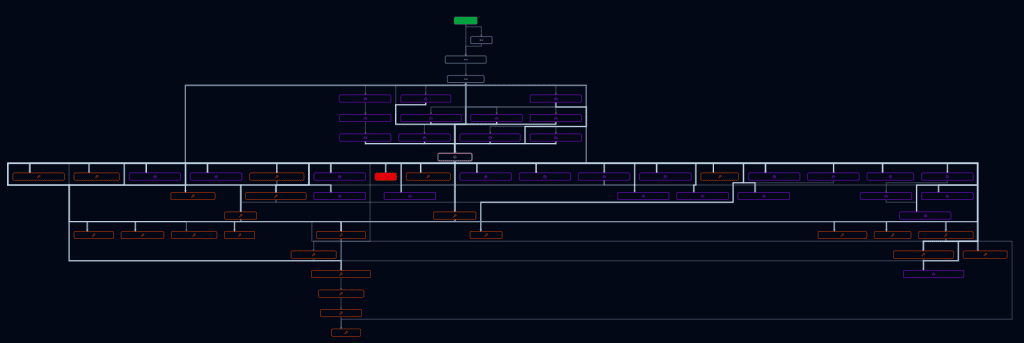
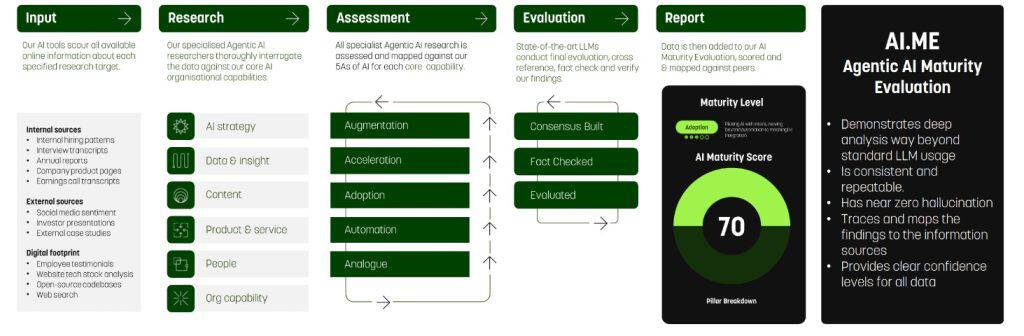
Inside, a research coordinator delegates to pillar specialists, each pillar with its own dedicated set of sub-agents. They all feed a shared intelligence bus, a central knowledge base any pillar can draw from. So when an annual-report researcher working on AI Strategy turns up something about people strategy, the People pillar sees it too. Above them sits an assessment council organised by maturity stage rather than by topic, so each assessor specialises in the signals that separate, say, genuine adoption from a well-funded pilot. Claims get triangulated. A press release announcing an “AI-driven supply chain” is checked against the hiring record and the visible tech stack, and if nobody is recruiting data engineers, the claim gets marked down.
Every finding carries a source and a reliability rating, and each company is scored against 180+ criteria across five pillars: AI Strategy, Data & Insight, Content, Product & Service, and People. The scores map to our 5As maturity curve, from Analogue through Automation, Adoption and Acceleration to Augmentation.
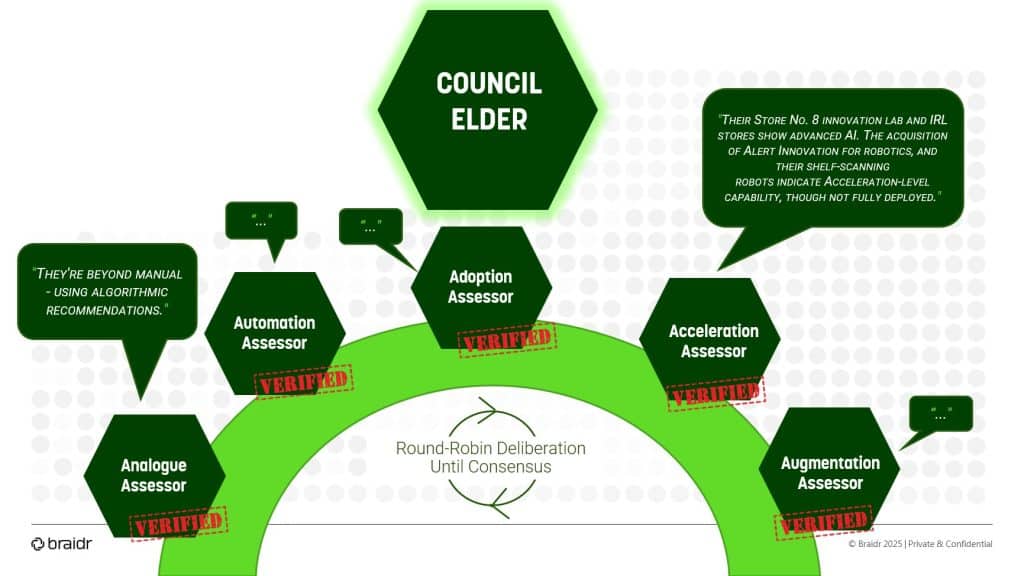
For the FTSE 350, that meant 1,750 scored pillar reviews built on 6,929 curated evidence findings from 5,878 distinct sources, 65% of them rated four or five out of five for reliability. Annual reports proved the most reliable source type; Glassdoor the least, which will surprise nobody who has read Glassdoor. The council ran 700 discussion rounds, and the full run took just under 99 hours of execution spread across a week in early June, a median of about 15 minutes per company. Along the way it read 1,042 annual reports, which is 1,042 more than I’ve managed this year.
One limitation shapes how all of it should be read, so it goes here rather than in a footnote: these scores measure publicly evidenced maturity. A company doing serious AI work it has no reason to publicise will score lower than it deserves. We’d rather carry that openly than pretend self-assessment would have fixed it. Self-assessment has the opposite problem, and it’s worse.
Then came the second problem
Scoring 350 companies gets you a dataset. It doesn’t get you a report. Between the two sits the temptation I opened with: hand the pile to a large language model and ask what it all means. The model will oblige. It will produce something fluent, confident and studded with statistics, some of which will be real. Something at Braidr we’ve come to call “Generically Plausible Text”.
We spend a lot of our working lives telling clients this is exactly how not to use AI on work that matters. So the analysis pipeline behind the FTSE 350 report was built around a single rule: the model is never the source of a fact.
The model doesn’t get a calculator
Python does the numbers. Every score, rank, sector average, correlation and gap metric in the report is calculated in code, deterministically. Run the pipeline twice on the same data and you get the same figures to the decimal. The model is never asked to do arithmetic, for roughly the reason you wouldn’t ask me to estimate how much time it takes to build something. You’d get a number. You just wouldn’t know where it came from.
And before anything clever happens, the pipeline does the unglamorous work: profiling the structure of the raw export so nothing gets silently dropped, flattening nested JSON into tables a human can inspect, flagging duplicate tickers and suspiciously thin text. None of this demos well, which is why it usually gets skipped, and why so much AI analysis quietly inherits whatever was wrong with its inputs.
Writing from the bundle
The model gets two jobs. The first is qualitative: distilling each company’s narrative evidence into structured signals. Strengths, weaknesses and whether a company reads as action-led or narrative-led. Every signal must be anchored to a verbatim quote from the underlying evidence, and a script then checks that the quote actually exists in the source text. No quote, no signal. It’s dropped.
The second job is the prose, written under constraint. Each report section receives an evidence pack containing the statistics, quotes and context that section is allowed to use, and nothing else. The executive summary sees cohort-level patterns; a pillar section sees pillar evidence. The model isn’t invited to roam the dataset, and it isn’t allowed to reach for whatever it half-remembers about NatWest from training. It works the way a barrister works from the bundle. If it isn’t in the pack, it doesn’t go in the argument.
Then a validator checks the lot. Every numeric claim has to cite an evidence key pointing back at the calculated data. Interpretive claims have to cite their support too. Mandatory caveats must appear in full, quote-backed evidence must be used where it exists, and when any of that fails, it fails loudly, naming the exact section, file and field.
Your company has a score in there already, built from evidence that’s public, whether you’ve looked at it or not. See what it says.



Want to receive updates from us?
Get the latest insights on AI, data and technology straight to your inbox.
No noise, just smart thinking from the team at Braidr.